Profiling test coverage
A great feature of the go test tool is the metrics and visualizations that it provides for test coverage.
Go ahead and try running the tests in our project using the -cover flag like so:
$ go test -cover ./...
?       snippetbox.alexedwards.net/ui	[no test files]
ok      snippetbox.alexedwards.net/cmd/web	0.013s          coverage: 45.7% of statements
        snippetbox.alexedwards.net/internal/models/mocks    coverage: 0.0% of statements
        snippetbox.alexedwards.net/internal/validator       coverage: 0.0% of statements
        snippetbox.alexedwards.net/internal/assert          coverage: 0.0% of statements
ok      snippetbox.alexedwards.net/internal/models	0.128s  coverage: 11.3% of statements
From the results here we can see that 46.9% of the statements in our cmd/web package are executed during our tests, and for our internal/models package the figure is 11.3%.
We can get a more detailed breakdown of test coverage by method and function by using the -coverprofile flag like so:
$ go test -coverprofile=/tmp/profile.out ./...
This will execute your tests as normal and — if all your tests pass — it will then write a coverage profile to a specific location. In the example above, we’ve instructed it to write the profile to /tmp/profile.out.
You can then view the coverage profile by using the go tool cover command like so:
$ go tool cover -func=/tmp/profile.out
snippetbox.alexedwards.net/cmd/web/handlers.go:15:          home                    0.0%
snippetbox.alexedwards.net/cmd/web/handlers.go:31:          snippetView             92.9%
snippetbox.alexedwards.net/cmd/web/handlers.go:62:          snippetCreate           0.0%
snippetbox.alexedwards.net/cmd/web/handlers.go:88:          snippetCreatePost       0.0%
snippetbox.alexedwards.net/cmd/web/handlers.go:131:         userSignup              100.0%
snippetbox.alexedwards.net/cmd/web/handlers.go:137:         userSignupPost          88.5%
snippetbox.alexedwards.net/cmd/web/handlers.go:192:         userLogin               0.0%
snippetbox.alexedwards.net/cmd/web/handlers.go:198:         userLoginPost           0.0%
snippetbox.alexedwards.net/cmd/web/handlers.go:256:         userLogoutPost          0.0%
snippetbox.alexedwards.net/cmd/web/handlers.go:277:         ping                    100.0%
snippetbox.alexedwards.net/cmd/web/helpers.go:17:           serverError             0.0%
snippetbox.alexedwards.net/cmd/web/helpers.go:30:           clientError             100.0%
snippetbox.alexedwards.net/cmd/web/helpers.go:37:           notFound                100.0%
snippetbox.alexedwards.net/cmd/web/helpers.go:41:           render                  58.3%
snippetbox.alexedwards.net/cmd/web/helpers.go:62:           newTemplateData         100.0%
snippetbox.alexedwards.net/cmd/web/helpers.go:73:           decodePostForm          50.0%
snippetbox.alexedwards.net/cmd/web/helpers.go:102:          isAuthenticated         75.0%
snippetbox.alexedwards.net/cmd/web/main.go:35:              main                    0.0%
snippetbox.alexedwards.net/cmd/web/main.go:100:             openDB                  0.0%
snippetbox.alexedwards.net/cmd/web/middleware.go:11:        commonHeaders           100.0%
snippetbox.alexedwards.net/cmd/web/middleware.go:26:        logRequest              100.0%
snippetbox.alexedwards.net/cmd/web/middleware.go:41:        recoverPanic            66.7%
snippetbox.alexedwards.net/cmd/web/middleware.go:61:        requireAuthentication   16.7%
snippetbox.alexedwards.net/cmd/web/middleware.go:83:        noSurf                  100.0%
snippetbox.alexedwards.net/cmd/web/middleware.go:94:        authenticate            38.5%
snippetbox.alexedwards.net/cmd/web/routes.go:12:            routes                  100.0%
snippetbox.alexedwards.net/cmd/web/templates.go:23:         humanDate               100.0%
snippetbox.alexedwards.net/cmd/web/templates.go:40:         newTemplateCache        83.3%
snippetbox.alexedwards.net/internal/models/snippets.go:31:  Insert                  0.0%
snippetbox.alexedwards.net/internal/models/snippets.go:60:  Get                     0.0%
snippetbox.alexedwards.net/internal/models/snippets.go:97:  Latest                  0.0%
snippetbox.alexedwards.net/internal/models/users.go:34:     Insert                  0.0%
snippetbox.alexedwards.net/internal/models/users.go:66:     Authenticate            0.0%
snippetbox.alexedwards.net/internal/models/users.go:98:     Exists                  100.0%
total:                                                      (statements)            38.1%
An alternative and more visual way to view the coverage profile is to use the -html flag instead of -func.
$ go tool cover -html=/tmp/profile.out
This will open a browser window containing a navigable and highlighted representation of your code, similar to this:
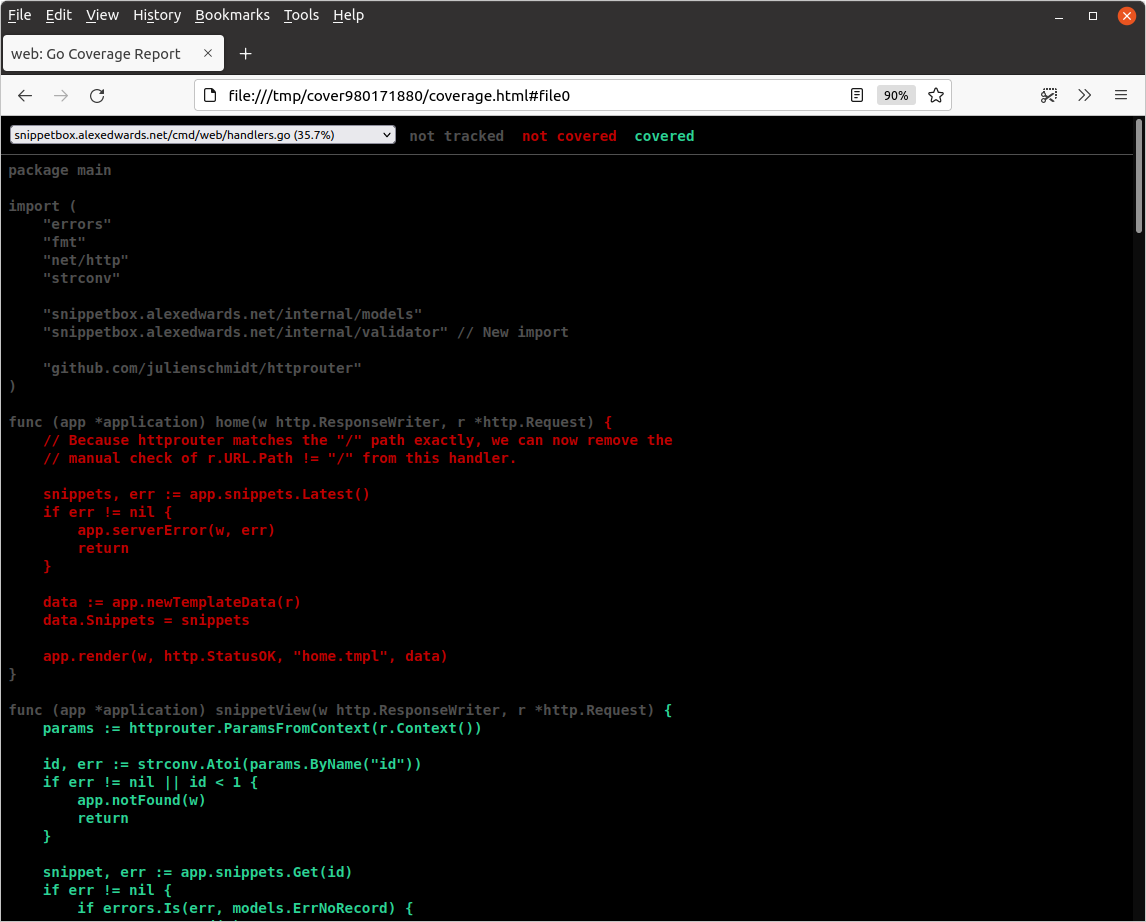
The statements which get executed during your tests are colored green, and those that are not executed are colored red. This makes it easy to see exactly what code is currently covered by your tests (unless you have red-green color blindness).
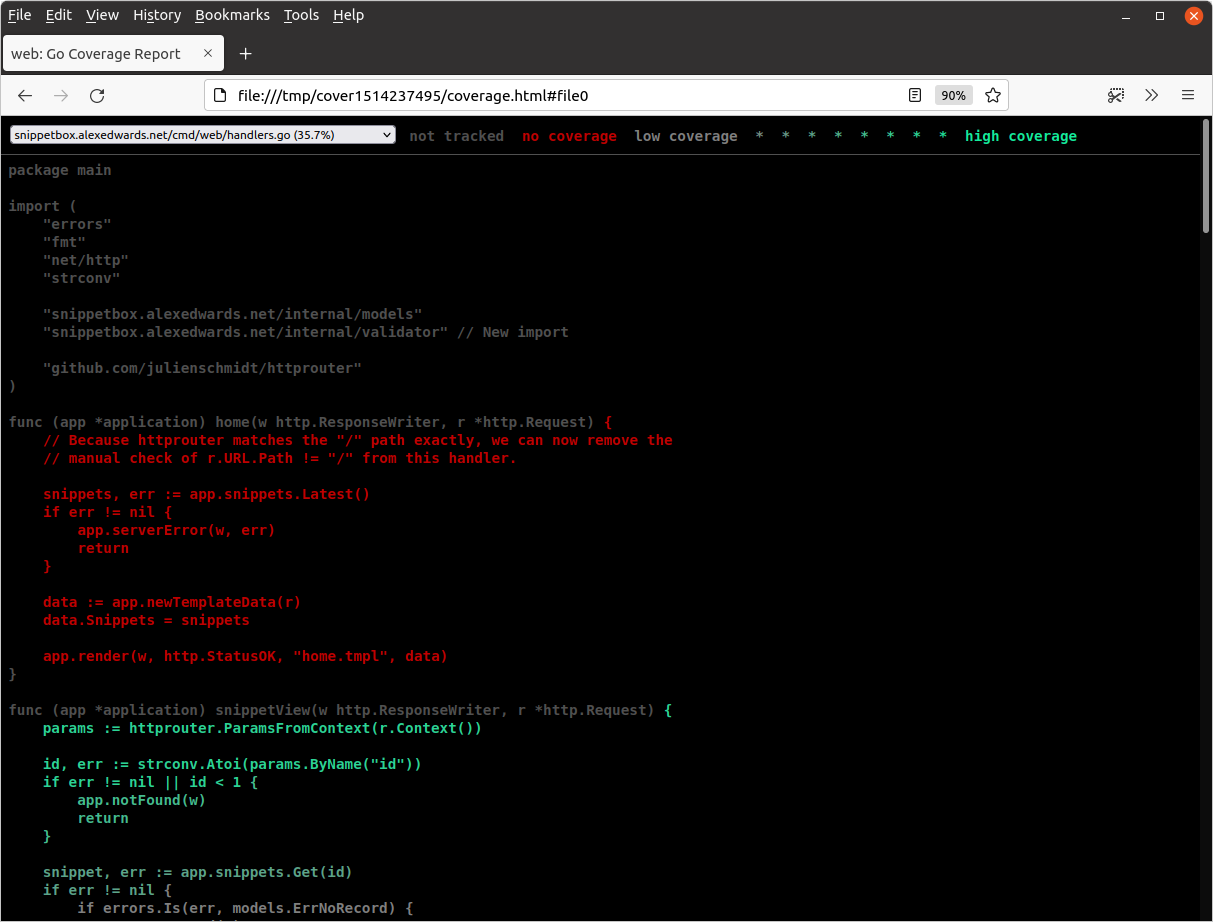
You can take this a step further and use the -covermode=count option when running go test like so:
$ go test -covermode=count -coverprofile=/tmp/profile.out ./...
$ go tool cover -html=/tmp/profile.out
Instead of just highlighting the statements in green and red, using -covermode=count makes the coverage profile record the exact number of times that each statement is executed during the tests.
When viewed in the browser, statements which are executed more frequently are then shown in a more saturated shade of green, similar to this: